Impact of Climatic Variability in the Respiratory Syncytial Virus Pattern in Children Under 5 Years-Old Using the Bulto Climatic Index in Cuba?
Yazenia L. Vega1, Odalys V. Ramirez2, Belsy A. Herrera2 and Paulo Lazaro Ortiz Bulto3*
1Provincial Meteorological Center, Meteorology Institute, Cuba
2National Reference Laboratory for influenza and other Respiratory Viruses, Institute of Tropical Medicine ‘’Pedro Kouri’’ (IPK)
3Climate Center, Meteorology Institute, Cuba
*Address for Correspondence: Paulo Lazaro Ortiz Bulto, Climate Center, Meteorology Institute, Cuba, Tel: + (53) 7 79-3 72 -68; E-mail: [email protected] (or) [email protected]
Submitted: 05 September 2017; Approved: 03 October 2017; Published: 05 October 2017
Citation this article: Vega YL, Ramirez OV, Herrera BA, Ortiz Bulto PL. Impact of Climatic Variability in the Respiratory Syncytial Virus Pattern in Children Under 5 Years-Old Using the Bulto Climatic Index in Cuba. Int J Virol Infect Dis. 2017;2(1): 014-019.
Copyright: © 2017 Vega YL, et al. This is an open access article distributed under the Creative Commons Attribution License, which permits unrestricted use, distribution, and reproduction in any medium, provided the original work is properly cited
Keywords: Climatic variability; Seasonality of RSV; Spatial analysis
Download FullteXt PDF
Background: In spite of the numerous researches and efforts made worldwide, there are still few studies in which information on climatic variability is used to understand the seasonal pattern of Respiratory Syncytial Virus (RSV) with a spatial - temporal scale. The objective of this study was to determine the association level between the RSV seasonality and the climatic variations in its spatial-temporal behavior.
Method: An ecological study using retrospective analyses of time series combined with spatial statistics was carried out. The series of RSV between 2010-2015 in children under 5 years-old and climatic indicators using climate variability and seasonal anomalies were analyzed by means of the Bulto-1 and 2 complex climatic indexes (BIs). To identify the areas of hot and cold spots a weight matrix by the “Queen” method of second-order contiguity was used. Spatial autocorrelation using global and local Moran’s Index was examined.
Results: A clear seasonal pattern of RSV was obtained, corresponding to the rainy climatic pattern. The higher viral circulation was observed during September-October, when the climatic anomalies increase. Through the BIs, a cumulative effect of the climate until 3 months was evidenced in the RSV. A high non-linear association between seasonality of climate variability and RSV was observed through BIs. An influence of the climate on the distribution of the virus was evidenced, with a strong positive spatial correlation (Moran’s I ˃ 0.7 during October in the central region).
Conclusions: There is a high association between the RSV seasonality and climatic variability. RSV circulates during the whole year, but not always in all provinces. The areas of higher virus circulation overlap with those in favorable climatic characteristics according to BIs. The months of higher virus activity correspond with the rainy season characterized by high temperatures, humidity and precipitation.
Introduction
No one today could be indifferent with the costs that infectious diseases cause to human populations. Given this situation, it is of great importance that the control programs rely on solid knowledge on the biology, ecology and evolution of hosts / viruses / environment systems. Variability and climate change are likely to interact with other forms of global changes (urbanization, migration, introduction of invasive species, etc.) which in turn change the transmission of pathogens in terrestrial ecosystems. Scientific evidence shows that climate variability influences in the increasing and distribution of infectious diseases. The effect of these changes and variations could be in both, direct (physiological variations) or indirect (interspecific interactions), in the transmission of viruses within or between different populations [1]. Anomalies in climate variability are becoming more frequent. The damages generated by these changes constitute the most significant environmental problem that humanity will face in the coming years. Efforts to reduce the magnitude of the impacts attributable to variability and climate change are currently one of the greatest challenges for the international scientific community, which may already be influencing human health, especially in the developing countries [2]. The role of the environment in the spread of respiratory infections is poorly understood. However, the seasonal patterns of almost all respiratory viruses are one of the most evident manifestations of the effect of the environment on its transmission [3]. Acute Respiratory Infections (ARI) are a major cause of morbidity and mortality worldwide and Respiratory Syncytial Virus (RSV) is the most common etiologic agent causing severe lower respiratory tract infections in children under 5 years old [4,5]. This virus causes a wide range of diseases ranging from a common cold to severe disease such as bronchiolitis and pneumonia [6].
It well known that during an epidemic 2 subgroups (A and B) and different genotypes within each subgroup circulate. Each year a different genotype circulates and predominates, which is replaced in the next epidemic [7]. Half of the children are infected with this virus in the first year of life; almost all children have been infected with the virus at two years old and approximately 50% have been infected twice [8]. In 2005, the incidence of ARI associated with RSV in children under 5 years old was estimated at 33.8 million, of which at least 3.4 million hospitalizations, 66,000-190,000 die annually, and 99% of these deaths occur in underdeveloped countries [4]. The RSV epidemics have a seasonal pattern and occur annually with substantial variation across countries and regions. In temperate countries epidemics occur in the winter months, with annual or biennial epidemics, associated with low temperatures, high humidity and precipitation, both in the northern and southern hemispheres. However, in countries with tropical climate, the studies are limited and virus activity has been associated with the rainy season [9]. Numerous studies in different regions of the world have showed the association between virus activity and different climatic elements: atmospheric pressure, relative humidity, temperature, rainfall, wind speed and direction, UV radiation and dew point [10].
Despite the importance of RSV as a respiratory pathogen, a licensed vaccine, the best single healthcare solution to an infectious disease, is currently unavailable [11]. Only prophylactic treatment with humanized monoclonal antibody (palivizumab) is available on the market. This antibody is highly expensive and is only used in a high-risk child with the aim of avoiding complications. Therefore, understanding the epidemiology and changes in the circulatory pattern of RSV is essential to design specific health actions that may have an impact on the application of certain preventive measures for the control and treatment of RSV [12]. In Cuba, epidemics of severe respiratory infections occur in children under 5 years old, affecting mainly children between 6 weeks and 6 months of age. The RSV virus was first detected in Cuba during an outbreak of bronchiolitis in 1967 [13]. Since then, a laboratory surveillance program was implemented using different diagnostic methods [14,15]. Studies conducted by Valdes [16,17] found that during an epidemic circulate both subgroups and different genotypes within each subgroup. However, research regarding the seasonality of the RSV and the influence of the climatic factors in the pattern of viral circulation has not been studied. The aim of the present study was to determine the level of correspondence between the seasonal RSV and the climatic variations in its spatial-temporal behavior.
Materials and Methods
Study Design
An ecological study using retrospective analyses of time series combined with spatial statistics was carried out.
Setting
Cuba is a mostly tropical country settled in the Caribbean Sea, with a rainy season in summer (Aw, according to Koppen climate classification). The average annual temperature ranges from 24°C till 26°C and higher in the lowlands and on the eastern coast, with temperatures lower than 20°C in the highest parts of the Sierra Maestra. Despite its tropical condition, some seasonal characteristics are present in its thermal regime, with two well-known seasons: summer (rainy season) from May to October, being July and August the warmest months; and winter (less rainy season) from November to April, being January and February the coldest months. The national average rain record is 1335 mm; however, drought events recurrently occur, the duration of which can persist for several years [18].
Participants
A total of 11462 clinical samples of children under five years of age with clinical diagnosis of influenza-like illness, severe acute respiratory infection, bronchiolitis and pertussis syndrome were included in the study.
Variables
Clinical: The total of samples processed in the National Reference Laboratory (NRL) and the positive samples of RSV diagnosed for both RSV type A and B, by provinces and month.
Climate: Monthly series of dissolved oxygen density in air (g / m2), maximum and minimum mean air temperatures (ºC), average thermal air oscillation, average relative humidity of air (%), (Mm), mean atmospheric pressure at sea level (hpa), total precipitation (mm) and the number of days with precipitation 0.1 mm.
Data source and Measurements
The clinical samples were obtained in the sentinel hospitals and ambulatory services from all provinces and sent to the NRL of the Institute of Tropical Medicine “Pedro Kouri”, for diagnosis and surveillance of ARI with possible viral etiology, between January / 2010 and December / 2015. For the detection of RSV a Real-Time Polymerase Chain Reaction assay (RT-RCP) [19] was used. The data of the climatic variables were obtained from the climate station network of the Meteorology Institute in the period 1981-2010 for the baseline and 2010-2015 for the current conditions.
Statistical methods
The complex climatic indexes (BI r, t, c) were developed by Ortiz [20-23]. The expression is generated from the analysis of the time series of the climatic variables described above, applying techniques of multivariate analysis of principal components to generate the weights or contributions of the variables to each index, obtaining the orthogonal functions. Interpretation of Bultó complex climate indexes BI1, t, c describes inter-monthly and inter-seasonal variation; includes maximum and minimum mean temperature, precipitation, atmospheric pressure, vapor pressure, and relative humidity. BI2, t, c describes seasonal and inter-annual variation; includes solar radiation and sunshine duration as factors that affect temperature and humidity. Positive values are associated with a high solar energy level. The calculation of the Moran´s spatial autocorrelation coefficient was predetermined for a matrix of neighbors with those stations that will be in a radius of 20 kilometers, which is the minimum distance in which all the stations had at least one neighbor. The statistical software S-Plus 2000, GS-plus 10.0 and SIG, ArcGIS 10.1 were used. For the processing of the series trends and the generation of the different maps at spatial scale WinStat.V1.0 software was used.
Results
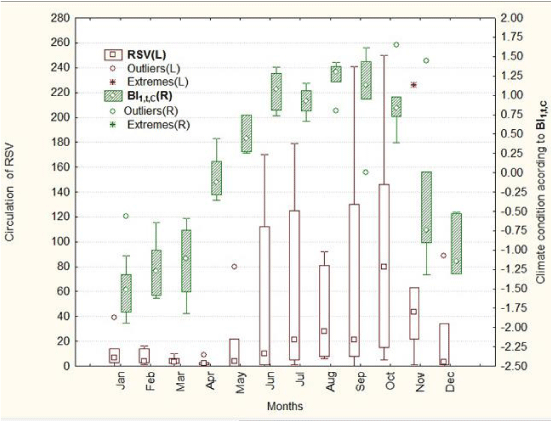
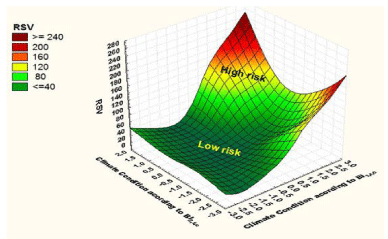
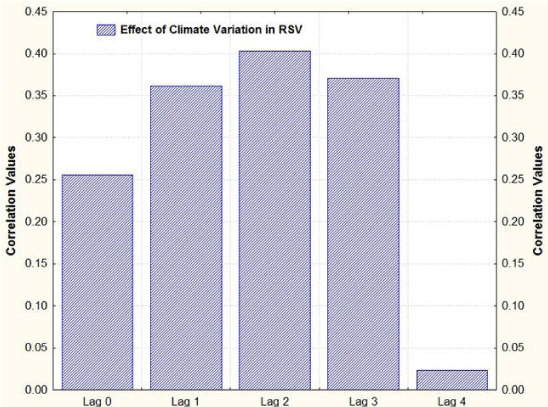
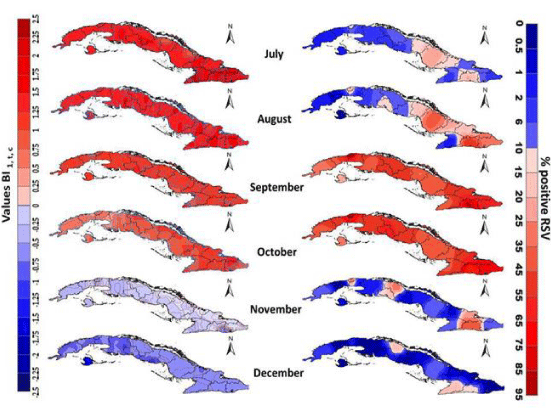
A total of 2643 clinical samples (23%) were positive for RSV. This proportion is similar to those previously published from others countries [24,25]. A clear seasonal pattern of RSV was obtained, which correspond to the climatic pattern, observing the main viral circulation during the rainy period, with the higher detection in September-October, when the climatic anomalies increase (Figure 1). A high non-linear association between seasonality of climate variability and RSV was observed through climatic indexes BI1, t, c and BI2, t, c (Figure 2). Figure 3 shows that, rather than determining the virus seasonal pattern and its association with the climatic variability pattern, is much more important to know what the cumulative effect of climate on RSV is. For this reason, the beginning and the lasting of the climate-virus interaction was determined (cumulative effect). In other words, the climate had an effect on the RSV that begun to manifest the following month and lasts up to three months.
Space relationship between RSV and BI
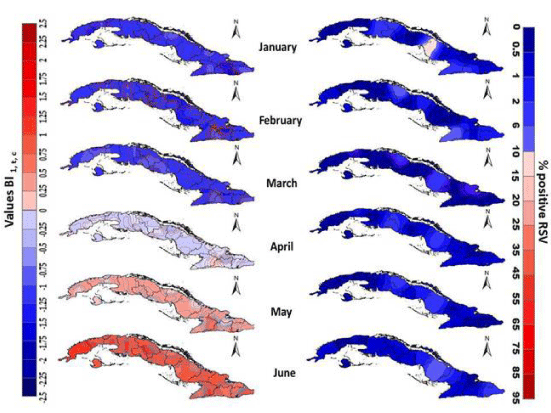
The climate index clearly describes the ranges of the climatic pattern variation for Cuba (Figures 4 and 5), leaving the rainy season defined as negative values of BI1, t, c, which are lower than -0.75), rainy season (positive values of BI1, t, c higher than 0.75), and the transition months which ranges since-0.75 to 0.75, as showed in the maps.
Spatial association between RSV and BI1, t, c (MLISA)
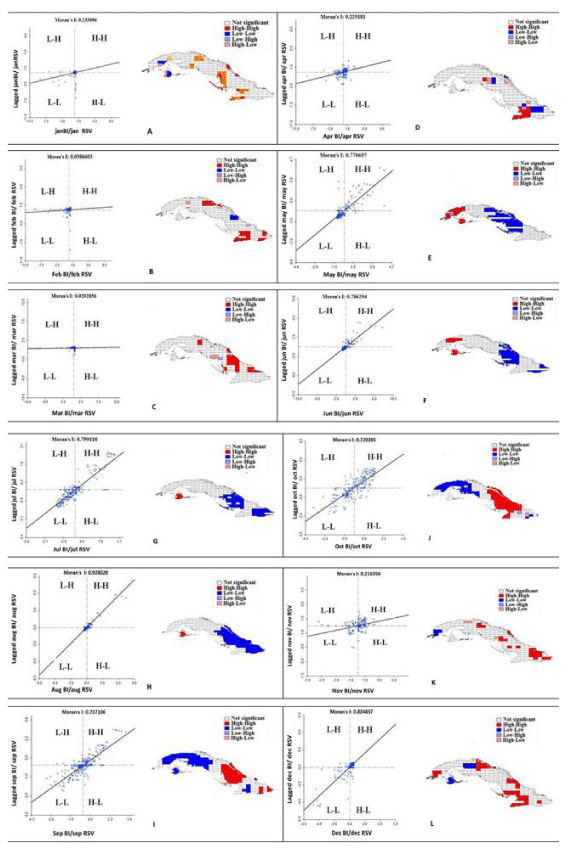
In the Moran scatter plot and the Scatter Map of the RSV effectiveness percent, a high concentration of points in the 1st and 3rd quadrant is shown. The presence of a high concentration of values between the index that describes the climatic variations and the behavior of the RSV was corroborated; evidencing the influence of the climate on the distribution and behavior of the virus. That allowed characterizing the presence of high-low values of virus circulation in the studies areas, as well as a strong positive spatial correlation (Figure 6 A-L).
Discussion
Seasonal patterns and its association with climatic variability
The analysis of the climatic variability and the seasonality of the virus activity can be evidenced. The higher risk moment is associated with the rainy period, characterized by high temperatures, humidity and precipitation with high numbers of cloudy days and low solar radiation. Then a low brightness is present, which is a favorable condition for the virus circulation. These values are reflecting somehow the changes in the circulation of the atmosphere in the country, where the months of the rainy season in which the index takes positive values, are associated with the establishments of the Azores-Bermuda anticyclone. Warmer and humid air masses reach the country, which characterize the rainy pattern; there is a high frequency of cloudy days, with a reduction in the thermal amplitude, increasing the frequency of rainy days, which leads to a decrease of hours with light. It is also observed that the values of the index correctly describe the variations in the transition months, which are not characterized in a similar way, neither with the same intensity. The months corresponding to the low rainy season are associated with the influence of extra-tropical phenomena and the greater or less influence of the continental anticyclone on the Cuban area, which defines the beginning of the west flow in Cuba. The variations in the country are not homogeneous. There are areas with greater variations, considering the geographic physical conditions, which could amplify or not the features previously described, which favor the virus circulation. I.e., the northern, central and southern plains of Camagüey, belonging to the central region, are characterized by a higher frequency of days with precipitation, humidity and greater numbers of cloudy days in the months corresponding to September and October. The index describes a different configuration coinciding with those described by Lecha [26] and with the regionalization of the index developed by Ortiz [21].
Local spatial association
These values are dissimilar; it means, there is spatial heterogeneity, which is associated with the diversity and configuration of the ecological components (biotic and abiotic); while in quadrants II and IV a low frequency of virus activity occurs. This configuration presents variations in intensity when passing from one seasonal period to another, which are highly significant in all periods analyzed, but not in all the areas studied. In all cases, the spatial autocorrelation contrast of the multivariate Moran’s I is clearly significant at a level of 5%, rejecting the hypothesis of the existence of a random distribution. The near regions in the space present similar values in terms of the behavior of the virus positivity proportion, in addition to a clear majority and significant association of areas that present high activity values in their neighboring localities, combined with areas presenting low values (H-H and L-L). An important result is the remarkable concentration of the mass of points in the quadrants I and III, with the predominance of a concentration in the space of similar values of H-H and L-L, especially in the central region of the country, with a very interesting change in the transition months from one seasonal period to another; the spatial structure is maintained, but not the configuration. This finding confirms the influence of the climatic variability in the spatial pattern of the RSV distribution, with a marked seasonality; although it is kept circulating in low frequency throughout the year as seen in the previous epigraph in the maps of the spatial distribution of the virus and in the correlograms where the months of low frequencies the circulation is framed in quadrant III. It is evident that there are very few areas with discrepancy between the value reached by a region and the average observed in its neighbors, reproducing very well the spatial variations and structures generated by the sampled information.
The significant clusters detected in the circulation of the virus in each of the areas do not manifest themselves in a dispersed (random) way in the territory, but are close to each other and concentrated in certain areas of the country near the flat areas (Camaguey and Las Tunas). There, highest values of humidity are reported, as well as number of days with precipitation, more frequent of cloudy days, which bring with them less light hours and therefore less luminosity, conditions that favor the high activity of RSV. Another notable aspect is that all the clusters identified concentrate similar values of the variables under study, and no region with a significantly dissimilar behavior was detected when is shown by its neighbors.
The positive frequency of RSV presents a clear spatial-temporal pattern in a global way, with a spatial structure changing by months and seasonal periods, with a marked spatial heterogeneity, showing areas of high conglomerates of high-low values that induce to the presence of clusters (hot and cold spots) in areas near the populated region. It is most notable the configuration of high values groups during the months September-October in which it reaches its maximum peak of circulation and that corresponds with the months of the rainy season. The analysis of the Moran index suggests that the spatial distribution of RSV is well defined for the tropical zone. That is, regions with high circulation values are located near other regions with relatively high values more frequently than if their location was due only to random factors. However, from distances greater than 900 meters, the Moran values indicate that a different configuration occurs: these take negative signs (I < 0), indicating that clusters of dissimilar values occur around a point, low circulation of RSV in scattered areas. This can be associated with very typical local conditions that favor the circulation of the virus throughout the year, keeping the presence of the virus in low levels [27-29].
Conclusions and futures perspective
The research demonstrated a high association between the seasonality of RSV and climatic variability through the BIs on a temporal and spatial scale in Cuba. It was evidenced that the RSV circulates during the whole year, but not always in all provinces. The areas of greater circulation coincide with the areas where the BIs present favorable characteristics for the virus circulation. The months of greater activity of the virus (September-October) corresponding to the rainy season with climatic characteristics of high temperatures, high humidity and precipitation, low insolation which leads to low luminosity, conditions very favorable for its circulation. Moreover, the use of the BIs by months in Cuba provides climatic information very useful for the epidemiological surveillance programs. Then, the results obtained allow proposing prediction models for the RSV circulation according to climatic conditions in a temporal and spatial scale. This could contribute to improve the information to the decision makers for the strengthening and implementation of preventive action in the health system.
Acknowledgements
Dr. Guadalupe Guzman. Coordinator of the project: Impact of climate on Aedes aegypti, dengue, Acute Diarrheal Diseases and Acute Respiratory Infections due to Influenza and SRV in the context of another environmental, demographic, epidemiological and microbiological variables. For the support provided for the realization of this research and paper review. The authors would like to thanks the staff members of the Network of meteorological stations, those working with the Cuban Meteorology Institute (particularly Dunia Hernandez and Maria del Carmen Rodriguez) for their assistance in the processing of the climatic data. Dr. Susana Borroto for the edition in English and paper review. We also thank the medical and laboratory personnel who provided specimens, in particular those working in the diagnosis of RSV (Mayra Mune, Amely Arencibia, Guelsys Gonzalez, Rosmery Roque, Barbara Hernandez). This project was partially supported by Ministry of Science, Technology and Environment (grant P211LH007 – 0023) and Ministry of Health (grant 131089).
Conflicts of interests
The authors declare that they have no conflict of interest.
Author’s Contributions
All authors participated in conceptualizing the design and coordination/data collection climatic and epidemiological. LY analyzed the data, work in the results interpretation and wrote the first draft; VO and AB worked in the epidemiological and virological analysis; OP worked in the statistical analysis and discussion, all authors read and approved the final manuscript.
- WHO. Using Climate to Predict Infectious Disease Outbreaks: A Review. Geneva. 2004. https://goo.gl/a2cvdb
- McMichel AJ, Cambpbell-Lendrum DH, Corvalan C, Ebi KL, Githeko A, Scheraga JD, et al. Climate Change and Human Health: Risks and Responses. Geneva. https://goo.gl/s6d7BG
- Lozano R, Naghavi M, Foreman K, Lim S, Shibuya K, Aboyans V, et al. Global and regional mortality from 235 causes of death for 20 age groups in 1990 and 2010: a systematic analysis for the Global Burden of Disease Study 2010. Lancet. 2012; 380: 2095-128. https://goo.gl/bXNfra
- Nair H, Nokes DJ, Gessner BD, Dherani M, Madhi SA, Singleton RJ, et al. Global burden of acute lower respiratory infections due to respiratory syncytial virus in young children: a systematic review and meta-analysis. Lancet. 2010; 375: 1545-55. https://goo.gl/EPtJrL
- Gil-Prieto R, Gonzalez-Escalada A, Marin-Garcia P, Gallardo-Pino C, Gil-de-Miguel A. Respiratory Syncytial Virus Bronchiolitis in Children up to 5 Years of Age in Spain: Epidemiology and Comorbidities. An Observational Study. Medicine (Baltimore). 2015; 94. https://goo.gl/jMTyY9
- Welliver RC. Respiratory syncytial virus and other respiratory viruses. Pediatr Infect Dis J. 2003; 22: 6-12. https://goo.gl/LXRUDM
- Cane PA. Molecular epidemiology of respiratory syncytial virus. Rev Med Virol. 2001; 11: 103-116. https://goo.gl/RmYCA6
- Gonzalez PA, Bueno SM, Carreno LJ, Riedel CA, Kalergis AM. Respiratory syncytial virus infection and immunity. Rev Med Virol. 2012; 22: 230-244. https://goo.gl/LXf859
- Paynter S, Yakob L, Simoes EA, Lucero MG, Tallo V, Nohynek H, et al. Using mathematical transmission modeling to investigate drivers of respiratory syncytial virus seasonality in children in the Philippines. PLoS One. 2014; 9. https://goo.gl/G1jBVK
- Zhang XL, Shao XJ, Wang J, Guo WL. Temporal characteristics of respiratory syncytial virus infection in children and its correlation with climatic factors at a public pediatric hospital in Suzhou. J Clin Virol. 2013; 58: 666-670. https://goo.gl/E3z4e8
- Rudraraju R, Jones BG, Sealy R, Surman SL, Hurwitz JL. Respiratory syncytial virus: current progress in vaccine development. Viruses. 2013; 5: 577–594. https://goo.gl/ugzXxi
- Herva´s D, Reina J, Yanez A, del Valle JM, Figuerola J, Hervas JA. Epidemiology of hospitalization for acute bronchiolitis in children: differences between RSV and non-RSV bronchiolitis. Eur J Clin Microbiol Infect Dis. 2012; 31: 1975–1981. https://goo.gl/wD9ZkW
- Mas P, Goyenechea A, Moluk A. Estudio Virologico de una epidemia de bronquiolitis. Bol Hig Epid. 1967; 5: 141-144.
- Goyenechea A, Razon R, Savon C, Valdivia A, Chacon D. Sarmiento L. Rapid detection of respiratory syncytial virus by indirect immunofluorescence in infants hospitalized with acute respiratory disease. Mem Inst Oswaldo Cruz. 1996; 91: 489-490. https://goo.gl/znqn6p
- Sarmiento L, Chacón D, Valdivia A, Savón C, Goyenechea A. Application of the polymerase chain reaction for detecting respiratory syncytial virus. Rev Cubana Med Trop. 1997; 49: 21-23. https://goo.gl/XeE3LK
- Valdés O, Martínez I, Valdivia A, Cancio R, Savón C, Goyenechea A, et al. Unusual antigenic and genetic characteristics of human respiratory syncytial viruses isolated in Cuba. J Virol. 1998; 72: 7589-7592. https://goo.gl/qgugdu
- Valdés O, Savón C, Goyenechea A, Palerm L, González-Muñoz G, González-Báez G, et al. Caracterización genética molecular del virus Sincitial respiratorio humano en Cuba. Biotecnología Aplicada, 2005; 22: 149-155.
- Planos E, Vega RyA, Guevara, Editores. Impacto del Cambio Climático y Medidas de Adaptación en Cuba. Instituto de Meteorología, Agencia de Medio Ambiente, Ministerio de Ciencia, Medio Ambiente y Tecnología. La Habana, Cuba. 2013; 430.
- Arens MQ, Buller RS, Rankin A, Mason S, Whetsell A, Agapov E, et al. Comparison of the Eragen Multi-Code Respiratory Virus Panel with conventional viral testing and real-time multiplex PCR assays for detection of respiratory viruses. J Clin Microbiol. 2010; 48: 2387-2395. https://goo.gl/dWT9aV
- Ortiz PL, Guevara V, Díaz M, Pérez A. Rapid assessment of methods /Models and human health sector sensitivity to climate change in Cuba. Climate Change: Impacts and Responses. Proceeding of the Conference on National Assessment Results of Climate Change and Health in San José, Costa Rica. 2000; Japan. 203-22.
- Ortiz PL, Rivero VA, Pérez RA. Modelos Autorregresivos espaciales para la simulación y pronósticos de enfermedades desde condiciones climáticas. Revista Cubana de Meteorología. 2005; 12: 73-92.
- Ortiz P L, Pérez AR, Rivero AV, Pérez AC, Ramon CJ, Lecha LE. La Variabilidad y el Cambio Climático en Cuba: Potenciales Impactos en la Salud Humana. Rev Cubana Salud Pública. 2008; 34. https://goo.gl/2Kmnng
- Ortiz PL, Rivero A, Linares Y, Pérez A, Vázquez JR. Spatial Models for Prediction and Early Warning of Aedes aegypti Proliferation from Data on Climate Change and Variability in Cuba. MEDICC Review. 2015; 17: 20-28. https://goo.gl/eazdA1
- Sirimi N, Miligkos M, Koutouzi F, Petridou E, Siahanidou T, Michos A. Respiratory syncytial virus activity and climate parameters during a 12-year period. J Med Virol. 2016; 88: 931-937. https://goo.gl/eCsp6y
- Vandini S, Corvaglia L, Alessandroni R, Aquilano G, Marsico C, Spinelli M, et al. Respiratory syncytial virus infection in infants and correlation with meteorological factors and air pollutants. Ital J Pediatr. 2013; 39: 1. https://goo.gl/c62iJ3
- Lecha EL, Paz RL y, Lapinel PB. El Clima de Cuba. Editorial Academia. La Habana. 1994; 186.
- Madsen T, Shine R. Rainfall and rats: Climatically‐driven dynamics of a tropical rodent population. Australian Journal of Ecology. 1999; 24: 80-89.
- Dearing MD, Dizney L. Ecology of hantavirus in a changing world. Ann N Y Acad Sci. 2010; 1195: 99-112. https://goo.gl/yiqrUR
- Yates TL, Mills JN. Community ecology of small mammal populations in Panama following an outbreak of Hantavirus pulmonary syndrome. J Vector Ecol. 2004; 29: 177-191. https://goo.gl/GFXkX6

Sign up for Article Alerts